Why I Use Weekly Charts Instead of Daily
Daily charts lie. Not because the data is wrong, but because the noise drowns out the signal. Every intraday shakeout, every algorithmic spike, every panic dip that reverses by lunch — all of it shows up on the daily. You start seeing setups that do not exist.
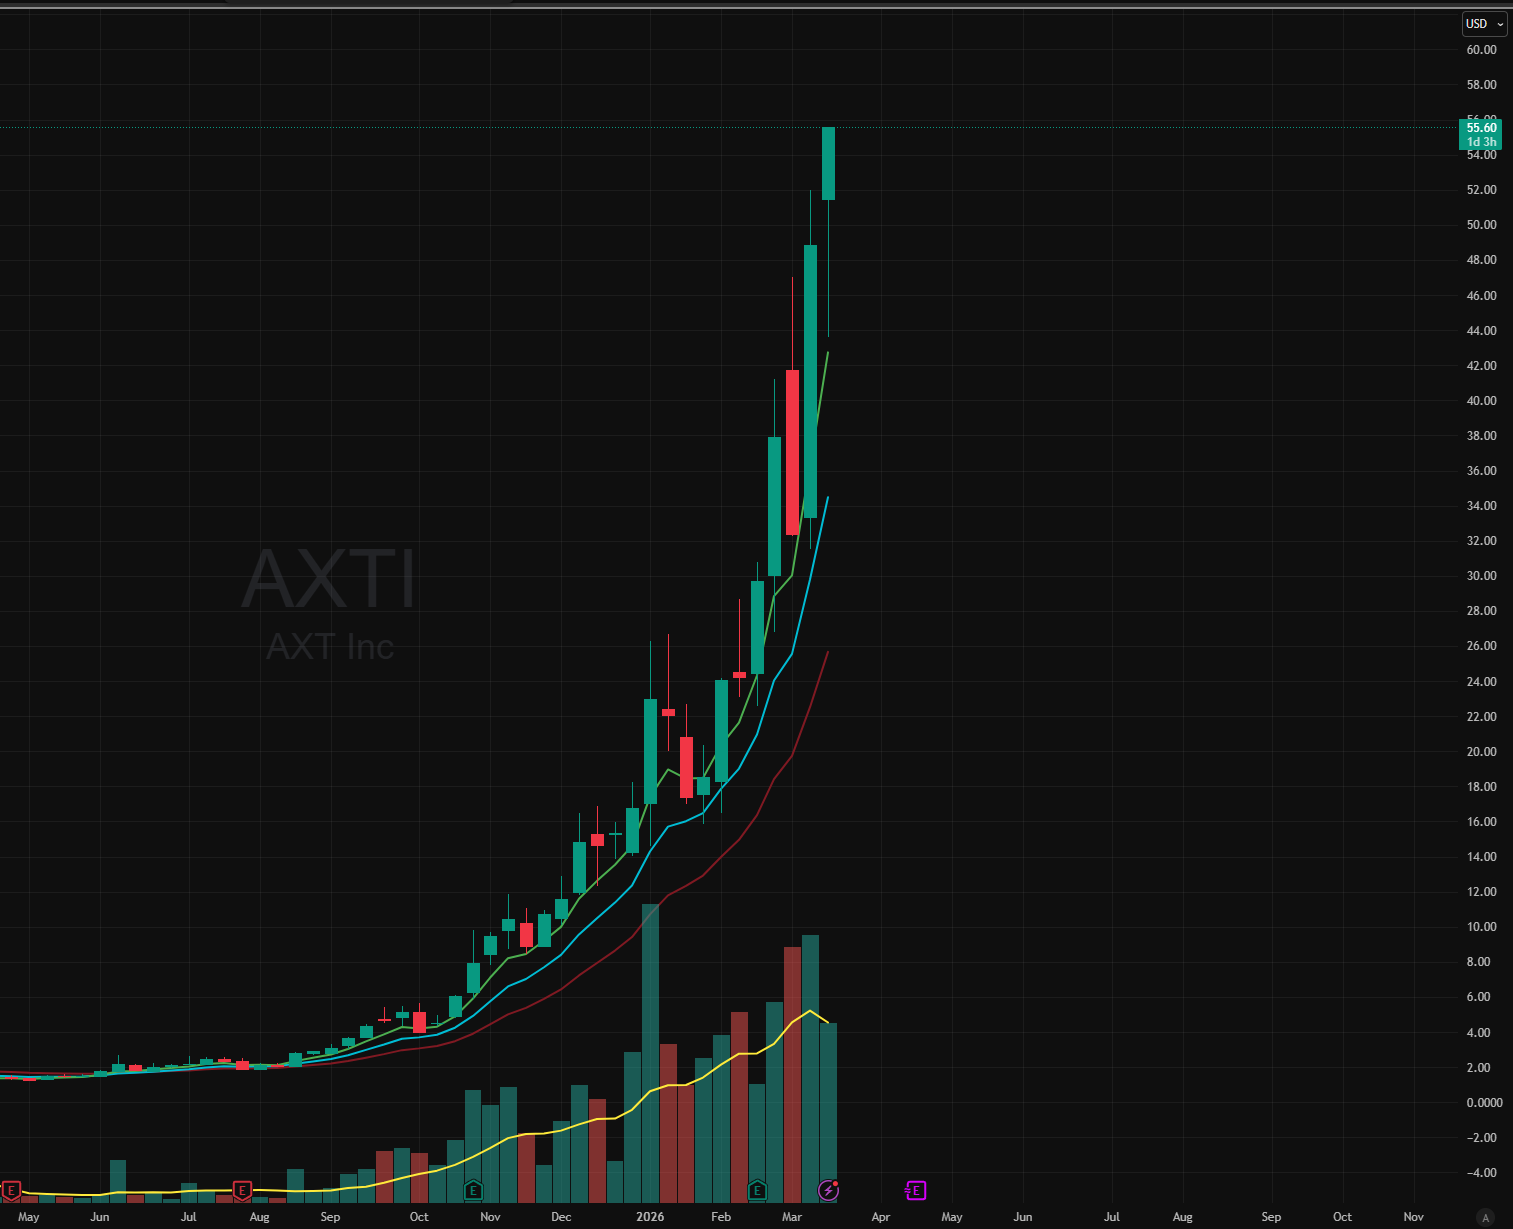
Weekly charts compress that noise into a single bar. One open, one close, one range. The institutions buying in size leave footprints on weekly timeframes. A three-day pullback that looks terrifying on the daily? On the weekly, it is a small dip in a stair-step uptrend. That shift in perspective changes what you trade and when you enter.
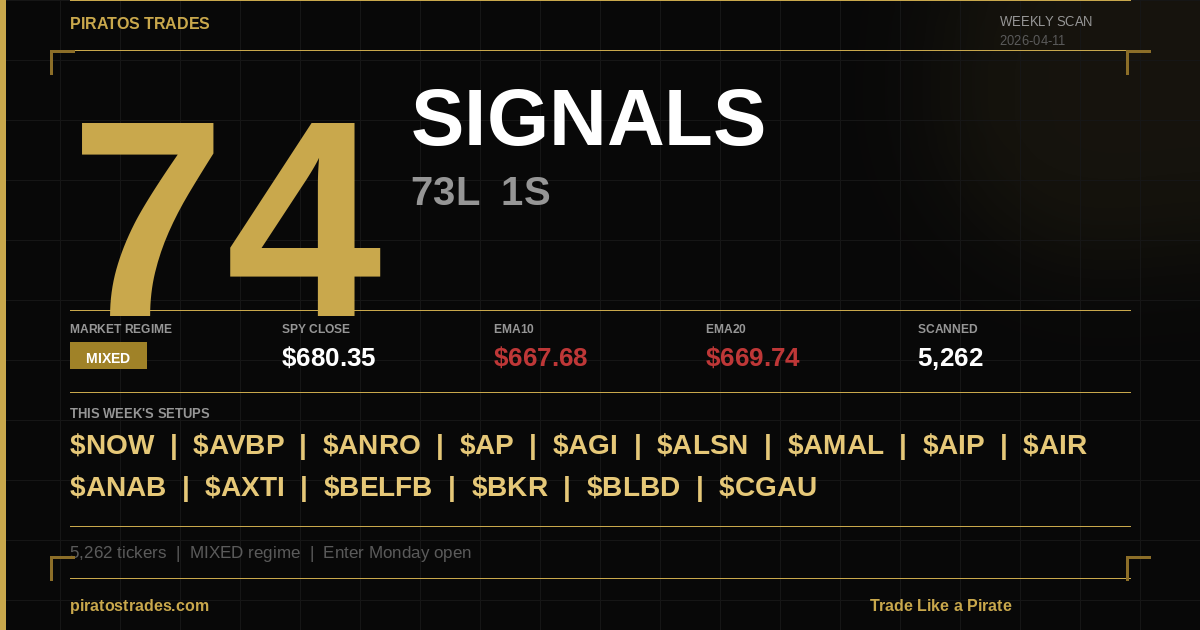
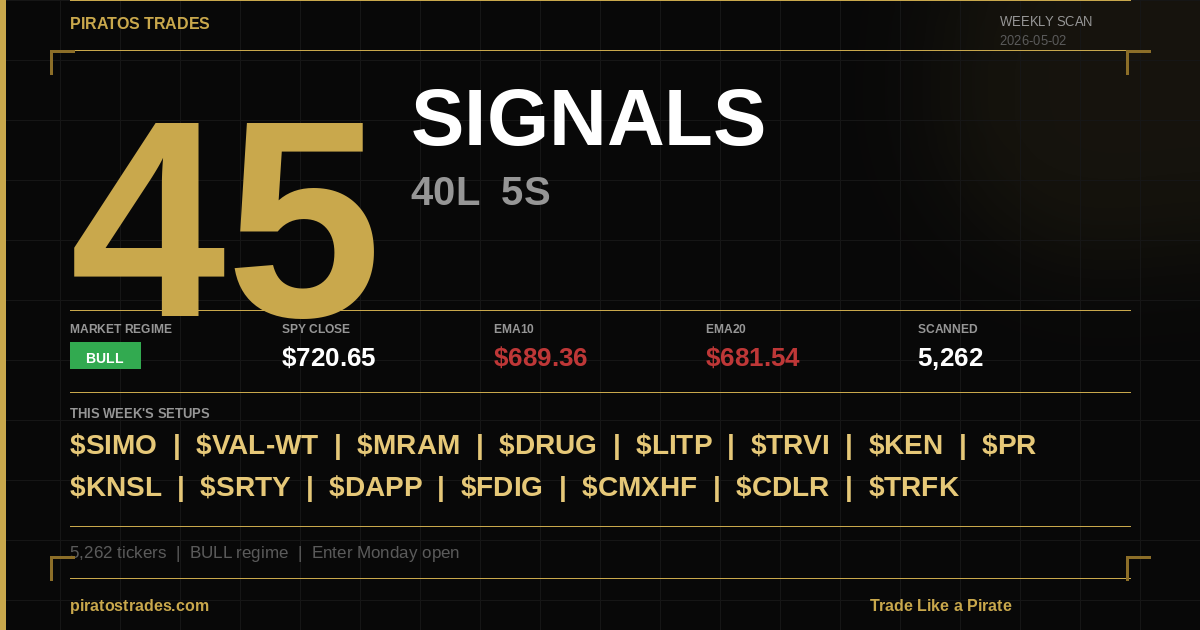
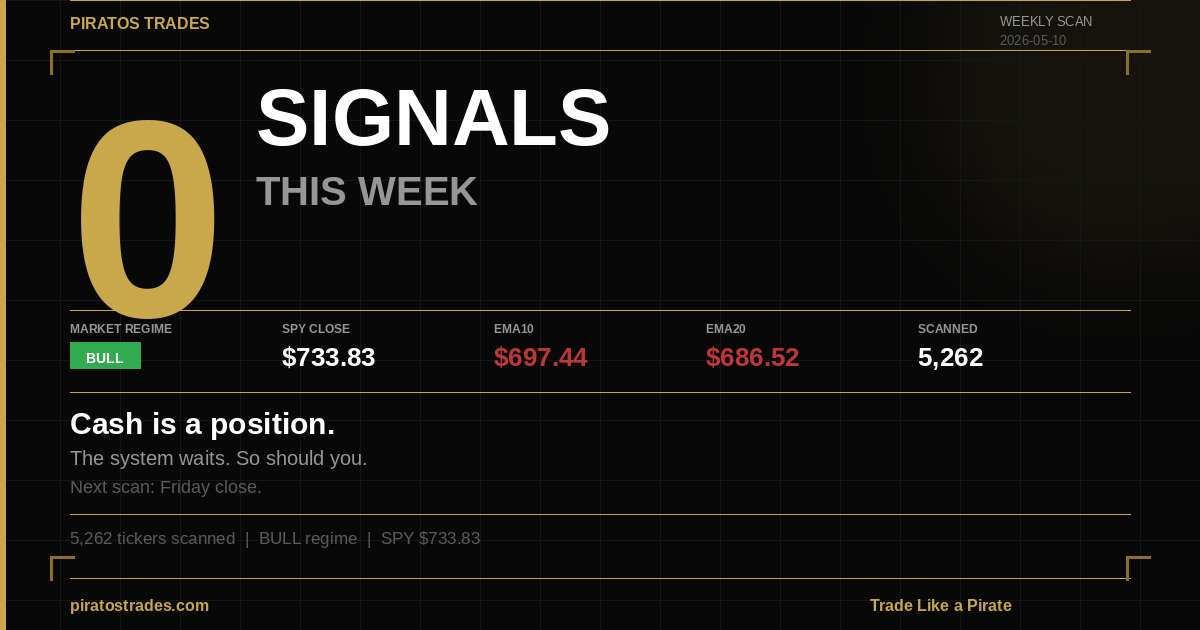
My entire system runs on weekly bars. The EMA stack, the regime filter, the base patterns — all of it. A stock has to prove itself over weeks, not hours. The scanner runs once, on Saturday, against weekly data. No intraday decisions. No adjusting stops because a candle looked scary at 2 PM on a Tuesday.
The weekly timeframe forces patience. You cannot chase a move that already happened five days ago. You see the base, you see the breakout, you see the volume. Then you wait until Monday. That waiting is the edge.
Trade Like a Pirate ☠️
—
📢 Free weekly scan + trade updates: t.me/PiratosTrades
🔒 Full trade details: piratostrades.com/vip
📈 TradingView | 🏦 IBKR